How We Develop Disease Models
Our disease model
We have created an Accurate and Mechanistic AI Assembly Line that uses Urine to Create Disease Models Without Having to Explicitly Identify Biomarkers or Design Unique Detection Methods per Disease. This process allows us to save up to a decade of research and development time.
At Luventix, we leverage urine-based diagnostics, Artificial Intelligence (Al) and Machine Learning (ML) to create disease models that accurately detect and distinguish between specific diseases. Our process transforms raw metabolic data from urine into information that provides valuable differential diagnostic insights and opportunities for early disease detection. Our platform will make the process of creating models for different diseases repeatable and mechanistic, because we do not need to explicitly identify disease biomarkers or to create a different method of detection for each separate disease that we model.

patients diagnosed with the specific disease (known or un-blind sample);

healthy individuals

symptomatic but either negative for the disease and/or have conditions that present similar symptoms

with diseases other than the disease for which we are modeling
To develop each specific disease model, we conduct stringent clinical trials. We begin each trial for a specific disease with urine from multiple types of patients to replicate real-world circumstances.
For example, if we are developing a disease model for colon cancer, we would collect samples from patients diagnosed with colon cancer, healthy individuals with no cancers, patients with gastrointestinal conditions that have symptoms similar to those of colon cancer, as well as from patients diagnosed with cancers other than colon cancer.
Signal detection using Artificial Intelligence (AI) and Machine Learning (ML)
We will then analyze urine via Gas Chromatography, delivering a readable digital file representing the metabolic state of the patient.

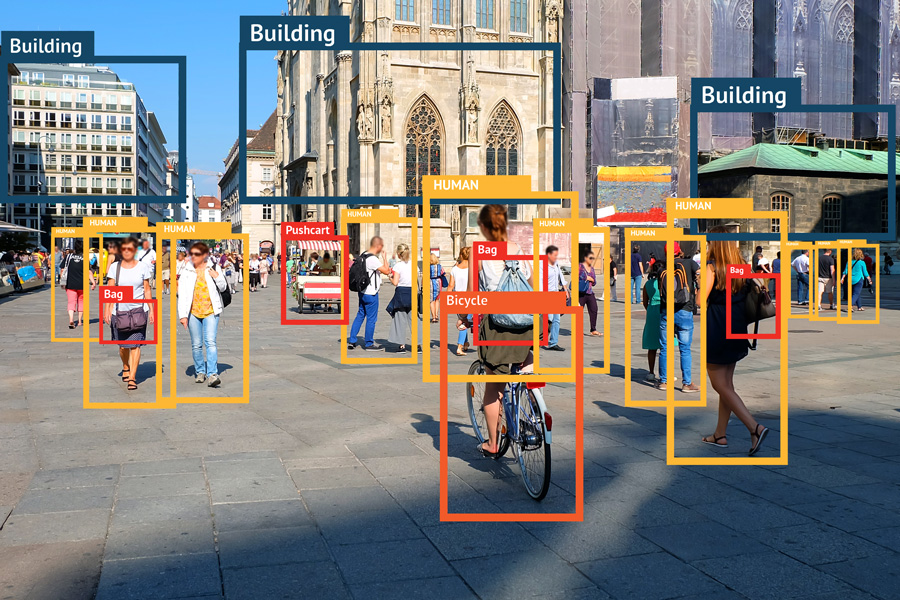
We leverage AI, ML, and deep learning algorithms to analyze that data and detect intricate patterns within it. This process involves comparing patterns of all kinds of patient types with and without the disease.
Very similar to the use of AI for face, speech or image recognition, our platform delves into the vast amount of data, meticulously classifying patterns and identifying the hidden connections, correlations, and characteristics that may indicate the presence or absence of certain diseases.
Validating a disease model for a specific disease
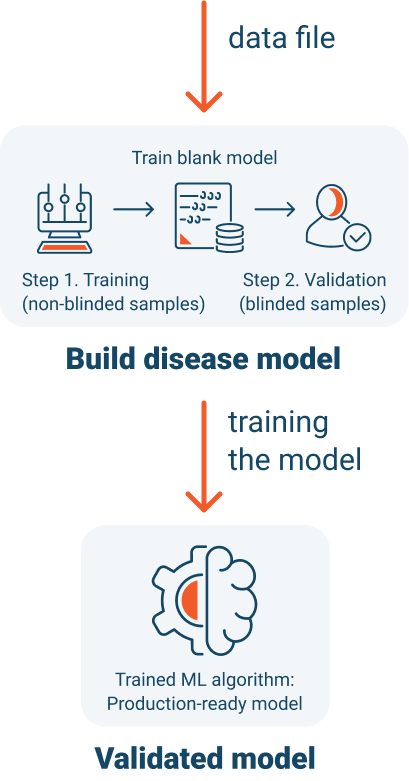
After we have detected a signal, we create a classification system around the signal and “train” our disease model. Training is conducted using known positive and negative samples.
During each clinical trial, we will determine specificity and sensitivity of the disease model, by performing a controlled blinded study.
We will exercise the trained model, by collecting blinded urine samples from patients with an unknown diagnosis.
We use the same gas chromatography process, for the blinded samples, to create a digital metabolic profile, or “Digital Twin”, of each patient’s metabolic state at a point in time.
A critical step to offering a Luventix test to patients is to demonstrate its accuracy and satisfy clinical trial selectivity and sensitivity target criteria.
What is a Digital Twin?

Using the Test Commercially to Screen and Diagnose Diseases
Once the disease model has been developed and trained, and the test validated, and approved for commercial release, the process of testing patient samples will be identical.


Building a Multi-Stage Approach to Diagnostic Reliability
Luventix has developed what we believe to be the most thorough process for developing an AI/ML Diagnostic Model to deliver a Credible, Repeatable Diagnostic Test Platform
Our platform is built upon 15+ years of experience solving complex drug discovery challenges for leading pharmaceutical companies. By applying AI and ML expertise to diagnostics, we created a platform designed for high reliability and adaptability across different diseases.

Drug Research
15+ yrs history delivering difficult to solve drug discovery problems using AI & ML for the largest drug companies and validating the methods

Academic Research
Understanding how the literature indicates our test will perform at screening a new disease/condition

Pre-Clinical Validation
Conduct IRB Guided studies with Major Clinics to validate modeling in a clinical environment

3rd Party Model Validation
Utilizing samples, for urine, blood and tissue that have been run through spectroscopy (GC, LC, GC/MS, LC/MS and MS) with sample sizes and varied demographics ranging from 20 to 1000

Validation (Humans & Canines)
IRB & PI lead observational study designed to validate, oncologic, autoimmune, inflammatory and infectious diseases across a varied population of over 1,250 patients
How We Measure Model Performance
During development, one of the best ways to quickly measure the performance of a disease model is known as the 'Area Under the Curve’. The Area Under the Curve (AUC) of the Receiver Operating Characteristic (ROC) curve is a metric for evaluating binary classification models, including disease prediction models. The scale ranges from 0 to 1.0.
Here's what different AUC values mean:
AUC =1.0: Perfect classification
AUC = 0.7 – 0.9: Good to excellent classification
AUC = 0.5: Random chance (equivalent to flipping a coin)
AUC < 0.5: Worse than random chance (suggests the model's predictions are inversely correlated with the truth)
AUC = 0: Perfect misclassification
At Luventix, we use these methods while in the research, model development, and comparative studies to assess the overall performance of tests or models across all thresholds, noting that it is less useful for making decisions in a clinical setting where a particular threshold is necessary.
When we have determined a test is commercially viable, we increase our sample sizes until we have converged our models, which mean additional samples don’t change the performance of the test.
It's only then, that we conduct blind testing – the industry standard – and determine Sensitivity, Specificity, Positive Predictive Value (PPV), and Negative Predictive Value (NPV).
Clinical Characterization in Humans and Canines
Our clinical characterization phase rigorously tests disease models in real-world conditions with diverse patient populations, ensuring they meet selectivity and sensitivity standards.
- Colonoscopy: Sensitivity/spec specificity >90%, no AUC as it's procedural
- FIT: AUC ~0.80–0.92.
- FOBT: AUC ~0.70–0.85.
- Stool DNA (Cologuard): AUC ~0.90–0.92.
- CT Colonography: AUC ~0.85–0.90.
- Blood Tests (e.g., SEPT9): AUC ~0.78–0.83
Test Development:
Initial Characterization
Optimized Model 50+50
AUC=0.978
- C-Reactive Protein (CRP):
AUC= 0.70-0.80 - Prometheus IBD sgi Diagnostic: AUC=0.70-0.80
- Transcriptomic and Proteomic Assay: AUC=0.85
Test Development:
Initial Characterization
Optimized Model 50+50
AUC=0.957
- Endoscopic Biopsy: Sensitivity/spec specificity ~100%, no AUC as it's procedural
- tTG-IgA: AUC~0.98, requires specific gluten containing diet
- DGP-IgG: AUC~0.91–0.94
Test Development:
Initial Characterization
Optimized Model 50+50
AUC=0.953
- Small Intestinal Aspiration and Culture: AUC: Not typically reported; sensitivity and specificity depend on contamination risk and sampling technique
- Lactulose Breath Test (LBT): AUC~0.65–0.80
- Glucose Breath Test (GBT): AUC~0.65–0.82
Test Development:
Initial Characterization
Optimized Model 50+50
AUC=0.977
Our canine disease models apply Luventix’ diagnostic technology to animal health, targeting common canine cancers with high prevalence rates.
Analytical Validation with 3rd Party Data
Ensuring diagnostic accuracy across diverse samples and techniques
Analytical validation is crucial for establishing the accuracy and reliability of our disease models. We modeled data sets that included samples using gas chromatography (GC), liquid chromatography (LC), and mass spectrometry (MS) to verify model performance across biological variances.
We utilize a diverse sample set – including urine, blood, and tissue samples – from multiple demographics. Sample sizes range from 20 to over 1,000, ensuring broad applicability.
Pre-Clinical Validation
Bladder and Prostate validation studies were conducted as internal research studies (results not independently validated).
Urine samples from healthy controls and patients presenting with bladder cancer symptoms were obtained from a urology clinic in Tallahassee, Florida, after approval from an Institutional Review Board from Tallahassee Memorial Hospital.
Drug Research
Luventix IP is developed from relevant biological data captured in an AI and ML-suitable process, for which an Omni-bus patent has been filed.
This data is then used to generate individual models using a specialized ML modeling architecture, specifically developed for diagnostic and clinical trial applications.
This modeling architecture has proven successful in multiple projects, representative partners highlighted below, related to drug discovery by Gradient Biomodelling’s founder who is also one of Luventix Co-Founders.

Resources
Testing and Diagnostics using Urine

- University of Alberta, Science Daily, September 5, 2013, Human Urine Metabolome: What Scientists can see in your urine.
- Haleem J. Issaq,* Ofer Nativ, Timothy Waybright, Brian Luke, Timothy D. Veenstra, Elias J. Issaq, Alexander Kravstov and Michael Mullerad,” Detection of Bladder Cancer in Human Urine by Metabolomic Profiling Using High-Performance Liquid Chromatography/Mass Spectrometry”, From the Laboratory of Proteomics and Analytical Technologies (HJ[, TW, TDV) and Advanced Biomedical Computing Center (BL), SAIC Frederick, Inc., NCI-Frederick, Frederick, Maryland, and Department of Urology, Bnai-Zion Medical Center (ON, EJI, AK, MM), Haifa, Israel, The Journal of Urology, Vol 179, 2422-2426, June 2008
- Jondavid Klipp, “FDA Lowers The Bar For AI Software Algorithms”, Laboratory Economics, February 2023, page 5
- Thomas Remer, Gabriela Montenegro-Bethancourt, Lijie Shi, Clinical Biochemistry, Volume 47, issue 18, December 2014, pages 307-311, Long-term Urine Biobanking: Storage stability of clinical chemical parameters under moderate freezing conditions without use of preservatives
- Wiktoria Struck, Malgorzata Waszczuk-Jankowska, Roman Kaliszan, Michal J. Markuszewski, “The state-of-the-art determination of urinary nucleosides using chromatographic techniques "hyphenated" with advanced bioinformatic methods”, Analytical and Bioanalytical Chemistry ,27 February 2011, Special issue “Biomarkers” with Guest Editors Boguslaw Buszewski and Jochen Schubert. Springer online (doi:I0.1007/s00216-0ll-4789-6)
- Jing Fan, Jing Hong, Jun-Duo Hu,1 and Jin-Lian Chen, “Ion Chromatography Based Urine Amino Acid Profiling Applied for Diagnosis of Gastric Cancer”, 2012, Hindawi Publishing Corporation Gastroenterology Research and Practice Volume 2012, Article ID 474907, 8 pages doi:10. l 155/2012/474907
- "Urine Specimens." Labcorp, 1 Jan. 2023, www.labcorp.com/resource/urine-specimens. Accessed 1 Apr. 2023.
- Liu KD, Siew ED, Reeves WB, Himmelfarb J, Go AS, Hsu C-y, et al. (2016) Storage Time and Urine Biomarker Levels in the ASSESS-AKI Study. PLoS ONE 11(10): e0164832. https://doi.org/10.1371/journal.pone.0164832
- Gebreyes, Kulleni, et al. "Breaking the Cost Curve." Deloitte, 2 Sept. 2021, www2.deloitte.com/us/en/insights/industry/health-care/future-health-care-spending.html. Accessed 1 Apr. 2023.
- Dr. Scott Tomlins, MD, PhD, “New Urine Test for Prostate Cancer Available; Unlike PSA Test, is ultra-specific for Prostate Cancer.”, Prostate Cancer Foundation, 25 Sept. 2013
- Discovery of New Chemical Entities for Alzheimer's Disease Tauopathy, 1R43AG053137-01A1 NIH/NIA phase I SBIR, 09/01/2016-08/31/2018
- A Quantum Similarity Approach for Discovery of Anti-Trypanosome Lead Drugs, 1R43AI114078-01 NIH/NIAID phase I SBIR, 05/15/2014-04/30/2016
- Discovery of Novel Anti-psychotics through Quantum Similarity 1R43MH101892-01, NIH/NIMH, 09/01/2013-07/31/2015
- A Quantum Physics Search for Liver-Stage Antimalarials, Grand Challenges Explorations Grant, Bill & Melinda Gates Foundation, 2012
- Identification of Nrf2 Activators Using an In Silico Modeling Platform, Followed by Evaluation of These Compounds in an Alpha-Synuclein Model of PD, MJFF Research Grant, Michael J. Fox Foundation for Parkinson’s Research, 2011
- Wittmann BM, Stirdivant SM, Mitchell MW, Wulff JE, McDunn JE, Li Z, et al. (2014) Bladder Cancer Biomarker Discovery Using Global Metabolomic Profiling of Urine. PLoS ONE 9(12): e115870. https://doi.org/10.1371/journal.pone.0115870
- David J. Sullivan, Yi Liu, Bryan T. Mott, Nikola Kaludov and Martin N. Martinov. Discovery of Novel Liver-Stage Antimalarials Through Quantum Similarity, PLoS ONE, May 7, 2015, DOI: 10.1371/journal.pone.0125593
- Sarah S. Dinges, Annika Hohm, Lindsey A. Vandergrift, Johannes Nowak, Piet Habbel, Igor A. Kaltashov & Leo L. Cheng, “Cancer metabolomic markers in urine: evidence, techniques and recommendations”, Nature, Nature Reviews Urology, 15 May 2019, Vol 16, pages 339–362
- T.P. Williamson, S.Amirahmadi, G.Joshi, N.K.Kaludov, M.N.Martinov, D.A.Johnson and J.A.Johnson Discovery of Potent, Novel Nrf2 Inducers via Quantum Modeling, Virtual Screening, and In Vitro Experimental Validation, Chem. Biol. Drug Des. 6:810, 2012
- D.J. Sullivan Jr, N.Kaludov and M.N. Martinov Discovery of Potent, Novel, Non-toxic Anti- malarial Compounds via Quantum Modeling, Virtual Screening and In Vitro Experimental Validation. Malaria Journal, 10:274, 2011
- Susan Horton, PhD, Kenneth A. Fleming, MBChB, Modupe Kuti, MBBS, Lai-Meng Looi, MBBS, Sanjay A. Pai, MD, Shahin Sayed, MBChB, MMed, and Michael L. Wilson, MD, “The Top 25 Laboratory Tests by Volume and Revenue in Five Different Countries”, American Journal of Clinical Pathology, 2019;151:446-451
- Jondavid Klipp, “U.S. Clinical Laboratory Industry Forecast & Trends 2020 – 2022”, Laboratory Economics, 2021
- Armstrong, J. A. Urinalysis in Western culture: a brief history. Kidney Int. 71, 384–387 (2007).
- Nemoto, R., Kato, T., Harada, M., Shibata, K. & Kano, M. Mass screening for urinary tract cancer with urine cytology. J. Cancer Res. Clin. Oncol. 104, 155–159 (1982).
- Theodorescu, D. et al. Discovery and validation of urinary biomarkers for prostate cancer. Proteomics Clin. Appl. 2, 556–570 (2008).
- Austdal M, Skråstad RB, Gundersen AS, Austgulen R, Iversen A-C, Bathen TF (2014) Metabolomic Biomarkers in Serum and Urine in Women with Preeclampsia. PLoS ONE 9(3): e91923. https://doi.org/10.1371/journal.pone.0091923
- Bröker MEE, Lalmahomed ZS, Roest HP, van HuizenNA, Dekker LJM, Calame W, et al. (2013) CollagenPeptides inUrine: A New Promising Biomarker for the Detection of Colorectal Liver Metastases. PLoSONE 8(8): e70918. https://doi.org/10.1371/journal.pone.0070918
- Imaizumi T,Nakatochi M, Akiyama S, Yamaguchi M, Kurosawa H, Hirayama Y, etal. (2016) UrinaryPodocalyxin as a Biomarker to Diagnose Membranous Nephropathy. PLoS ONE 11(9): e0163507.
- A. Jemal, R. Siegel, J. Xu, and E. Ward, “Cancer statistics, 2010,” CA Cancer Journal for Clinicians,vol. 60, no.5, pp. 277–300, 2010.
- D. J. McConkey, S. Lee, W. Choi et al., “Molecular genetics of bladder cancer: emerging mechanisms of tumor initiation and progression,” Urologic Oncology, vol. 28, no. 4, pp. 429–440, 2010.
- M. S. Cookson, H. W. Herr, Z. F. Zhang, S. Soloway, P. C. Sogani, and W. R. Fair, “The treated natural history of high risk superficial bladder cancer: 15-year outcome,” Journal of Urology, vol. 158, no.1, pp. 62–67, 1997.
- M. S. Soloway, M. Sofer, and A. Vaidya, “Contemporary management of stage T1 transitional cell carcinoma of the bladder,” Journal of Urology, vol. 167, no. 4, pp.1573–1583,2002.
- Mufti GR, Singh M. Value of random mucosal biopsies in the management of superficial bladder cancer. Eur. Urol. 22:289-93, 1992
- Kriegmair M., Baumgartner R, Lumper W, WaidelichR, Hofstetter A. Early clinical experience with 5-aminolevulinic acid for the photodynamic therapy of superficial bladder cancer. Br. J. Urol 155:105-9, 1996
- G. Bepler, M. Begum, and G. R. Simon, “Molecular analysis-based treatment strategies for non-small cell lung cancer,” Cancer Control, vol.15, no.2, pp.130–139, 2008.
- Breiman L. Heuristics of instability and stabilization in model selection. Ann Stat 1996;24:2350–83.
- Braga-NetoUM, Dougherty ER. Is cross-validation valid for small-sample microarray classification Bioinformatics 2004; 20:374–80.
- Shariat SF, Karakiewicz PI, Ashfaq R, Lerner SP, Palapattu GS, Cote RJ, Sagalowsky AI, Lotan Y. Multiple biomarkers improve prediction of bladder cancer recurrence and mortality in patients undergoing cystectomy. Cancer. 2008 Jan 15; 112(2):315-25.
- Bolenz C, Lotan Y. Molecular biomarkers for urothelial carcinoma of the bladder: challenges in clinical use. Nat Clin Pract Urol. 2008 Dec;5(12):676-85.
- Anderson NL, Anderson NG. The human plasma proteome—history, character, and diagnostic prospects. Mol Cell Proteomics 2002;1: 845–67.
- Pearson H. Meet the human metabolome. Nature2007;446:8.
- Bujak R, Daghir E, Rybka J, Koslinski P, Markuszewski MJ. Metabolomics in urogenital cancer. Bioanalysis. 2011Apr;3(8):913-23.
- Zheng S, Xue T, Wang B, Guo H and Liu Q (2022), Application of network pharmacology in the study of the mechanism of action of traditional chinese medicine in the treatment of COVID-19. Front. Pharmacol. 13:926901.
- Thomas JP, Modos D, Korcsmaros T and Brooks-Warburton J (2021) Network Biology Approaches to Achieve Precision Medicine in Inflammatory Bowel Disease. Front. Genet. 12:760501.
- Hopkins AL. Network pharmacology. Nat Biotechnol. 2007 Oct;25(10):1110-1. doi: 10.1038/nbt1007-1110. PMID: 17921993.
- Vidal M, Cusick ME, Barabási AL. Interactome networks and human disease. Cell. 2011 Mar 18;144(6):986-98. doi: 10.1016/j.cell.2011.02.016. PMID: 21414488; PMCID: PMC3102045.
- Ma C, Xu T, Sun X, Zhang S, Liu S, Fan S, Lei C, Tang F, Zhai C, Li C, Luo J, Wang Q, Wei W, Wang X, Cheng F. Network Pharmacology and Bioinformatics Approach Reveals the Therapeutic Mechanism of Action of Baicalein in Hepatocellular Carcinoma. Evid Based Complement Alternat Med. 2019 Feb 12;2019:7518374.
- Tebani A, Afonso C, Bekri S. Advances in metabolome information retrieval: turning chemistry into biology. Part I: analytical chemistry of the metabolome. J Inherit Metab Dis. 2018 May;41(3):379-391. doi: 10.1007/s10545-017-0074-y. Epub 2017 Aug 24.
Bibliography – Digital Twin

References

Definitions
Screening Test
Screening tests are used to detect disease in people who do not have any symptoms. They are often used to identify people who are at high risk for a particular disease, so that they can be monitored or treated early. For example, a mammogram is a screening test for breast cancer.
Diagnostic Test
Diagnostic tests are used to confirm or rule out a diagnosis of disease in people who have symptoms. They are more specific than screening tests, meaning that they are less likely to give a false positive result. For example, a biopsy is a diagnostic test for breast cancer.
Overfitting
In statistics and machine learning, overfitting refers to a model that is too complex and captures the noise in the training data rather than the underlying pattern. When a model overfits, it performs very well on the training dataset but poorly on new, unseen data because it has essentially memorized the training examples instead of learning to generalize from them.
Key characteristics of overfitting include:
High training accuracy: The model performs exceptionally well on the training set.
Low test accuracy: When evaluated on a separate test set, the model struggles, indicating poor generalization.
Complexity: The model may have too many parameters relative to the amount of training data, leading to a lack of robustness.
To mitigate overfitting, techniques like cross-validation, regularization, and pruning (in decision trees) are often used, along with ensuring sufficient training data. Best validation and most exhaustive cross-validation is leave-one-out, best clinical validation is blind testing and we do both.


